
Skip Cleaning or Accept a Worse Roof Face? Dust on an Ahvaz Array
On 8 kW in Ahvaz, skipping washes for ~90 days at a moderate dusty rate costs ~552 kWh/year more than weekly cleaning, more than a clean array rotated 45° off south.
Method note
Modeled 8 kW fixed arrays at Ahvaz (31.3203°N, 48.6692°E). Clean monthly AC comes from the JRC PVGIS PVcalc API v5_2 (run 2026-07-31): tilt 31°, aspects 0° (south), 45° (southwest), and 90° (west), with 10% non-soiling system loss so dust can be layered separately. Soiling uses a linear sawtooth between washes: daily rate × days until clean, average loss ≈ peak/2 (with a 40% peak cap for extreme dry stretches). Daily rates are literature bands for dusty arid climates, not Ahvaz field meters: 0.10%/day (moderate, within NREL soiling-station dry-period ranges commonly ~0.03–0.15%/day) and 0.25%/day (high arid band within published field rates up to ~0.4–0.5%/day). Background: soiling and monitoring and panel maintenance.
Direct answer
Clean south on this Ahvaz run yields 13,301 kWh/year. Rotating the same clean array 45° toward southwest costs about 397 kWh/year (−3.0%). At a moderate dusty rate (0.10%/day), cleaning every 90 days instead of every 7 days costs about 552 kWh/year more. That extra soiling loss already exceeds the mild orientation penalty. At a high arid rate (0.25%/day), a 90-day interval alone loses about 1,496 kWh/year versus clean south (~11%). Thesis: in a dusty climate, wash discipline is often a larger annual lever than fretting over a modest compass compromise on an otherwise clean roof.
Hypothesis
On an 8 kW Ahvaz south rooftop, skipping washes for about 90 days at a dusty-climate soiling rate costs more annual energy than a mild 45° southwest orientation compromise on a regularly cleaned array at the same site.
Inputs
| Input | Value | Source | Your site may differ |
|---|---|---|---|
| Location | Ahvaz 31.3203, 48.6692 | Chosen dusty hot lowland coordinate | Microclimate, roads, industry |
| Array | 8 kW DC, tilt 31° | Fixed across scenarios | Match your roof |
| Non-soiling loss | 10% | Separates wiring/inverter/mismatch from dust | Your proposal may bundle soiling into 14% |
| Clean orientations | South 0°, SW 45°, west 90° | PVGIS PVcalc 2026-07-31 | Roof azimuth constraints |
| Moderate soiling rate | 0.10%/day | Within NREL soiling-station dry-period band (~0.03–0.15%/day) | Local dust, tilt, rain |
| High soiling rate | 0.25%/day | High arid literature band (field rates to ~0.4–0.5%/day) | Dust storms, cement, agriculture |
| Cleaning intervals | 7 / 30 / 90 / 180 days | Stated O&M scenarios | Rain may reset sooner |
| Peak soiling cap | 40% | Order of severe MENA peaks in NREL soiling briefings | Sticky films may need manual wash |
Clean PVGIS baseline for Ahvaz
| Orientation | Annual AC (kWh) | Δ vs south |
|---|---|---|
| South (0°) | 13,301 | baseline |
| Southwest 45° | 12,904 | −397 (−3.0%) |
| West 90° | 11,407 | −1,894 (−14.2%) |
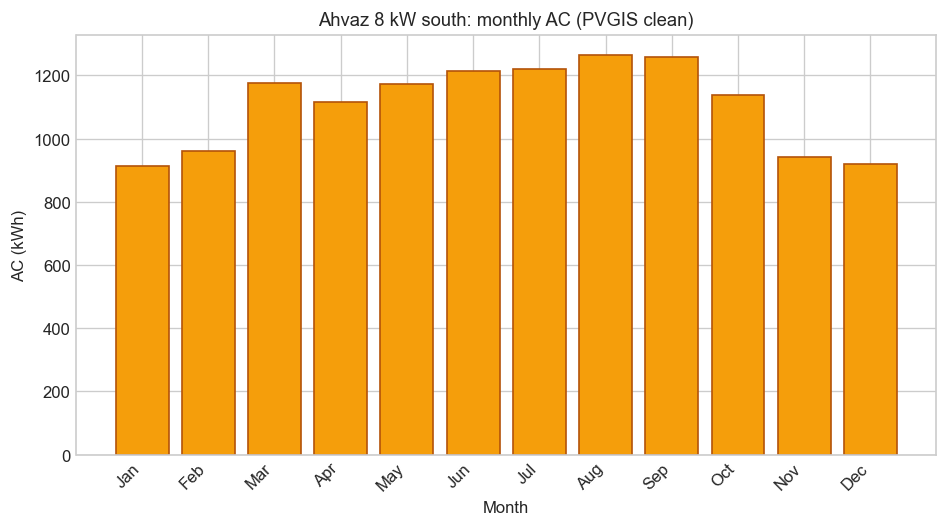
Figure: monthly AC for the clean south Ahvaz baseline (PVGIS PVcalc, 2026-07-31).
A full west face is a large design hit. A 45° southwest compromise is real but modest next to what prolonged dry soiling can do.
How much does cleaning interval cost on south-facing Ahvaz?
Average annual soiling loss for a linear sawtooth is half the peak loss between washes (until the 40% cap bites).
| Rate | Interval | Peak loss | Avg loss | Annual AC (kWh) | Lost vs clean south |
|---|---|---|---|---|---|
| 0.10%/day | 7 days | 0.7% | 0.35% | 13,255 | 47 |
| 0.10%/day | 30 days | 3.0% | 1.5% | 13,102 | 200 |
| 0.10%/day | 90 days | 9.0% | 4.5% | 12,703 | 599 |
| 0.10%/day | 180 days | 18.0% | 9.0% | 12,104 | 1,197 |
| 0.25%/day | 7 days | 1.8% | 0.9% | 13,184 | 117 |
| 0.25%/day | 30 days | 7.5% | 3.8% | 12,802 | 499 |
| 0.25%/day | 90 days | 22.5% | 11.3% | 11,805 | 1,496 |
| 0.25%/day | 180 days | 40% cap | 22.2% | 10,346 | 2,956 |
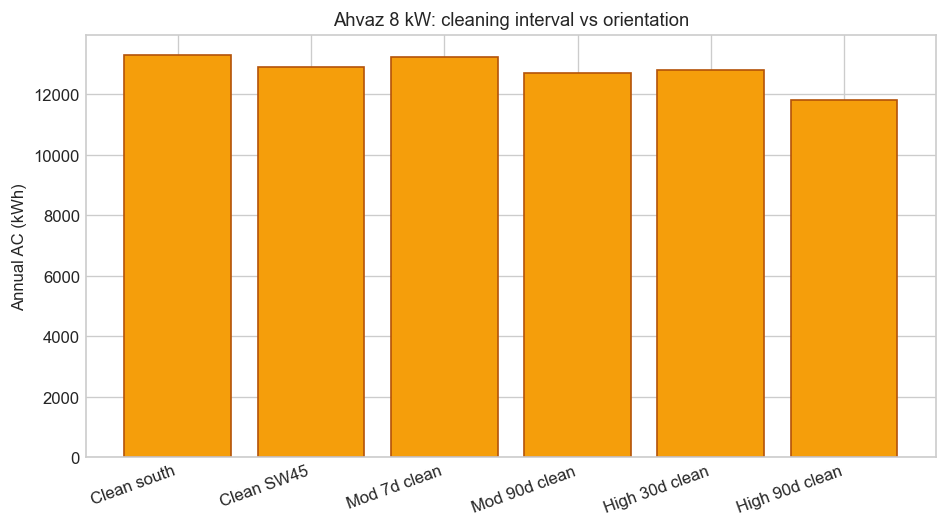
Figure: annual AC for clean orientations and selected cleaning intervals.
Does skipping washes beat a mild orientation compromise?
| Cost of inaction (kWh/year) | Value |
|---|---|
| Clean SW45 vs clean south | 397 |
| Clean west vs clean south | 1,894 |
| Moderate rate: 90-day vs weekly | 552 |
| High rate: 90-day vs monthly | 998 |
| High rate: 90-day vs clean south | 1,496 |
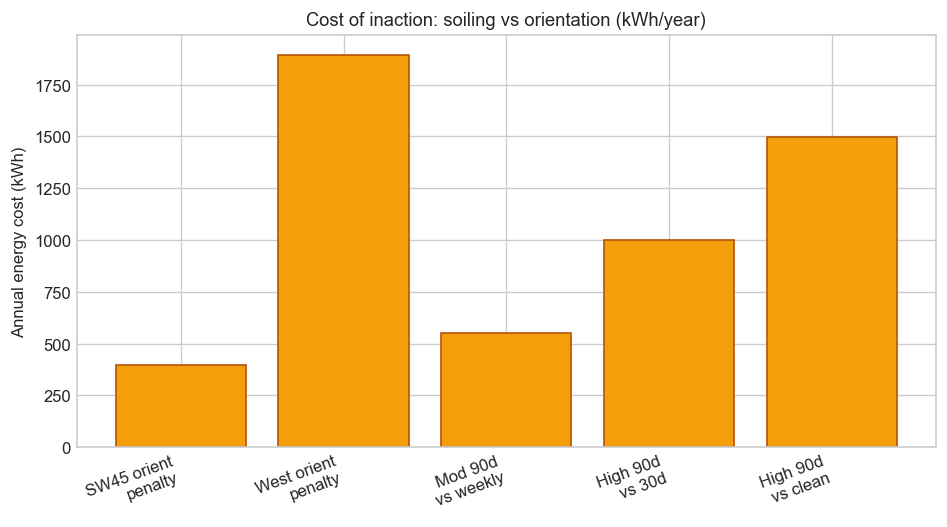
Figure: annual energy cost of orientation compromise versus delayed cleaning.
At the moderate dusty rate, the extra loss from 90-day versus weekly cleaning (552 kWh) exceeds the SW45 penalty (397 kWh). Hypothesis holds. At the high arid rate, even absolute 90-day soiling (1,496 kWh) dwarfs that mild compass hit and approaches the scale of a full west-facing roof.
NREL soiling briefings note Middle East annual losses can reach 20% or more when cleaning is weak, with peak losses after dust events far higher. This Ahvaz model is a controlled comparison, not a claim that every Khuzestan roof hits those extremes. See also what affects production and tilt and orientation.
What this means
Homeowners often treat orientation as destiny and cleaning as optional housekeeping. On this dusty-climate run, the opposite ranking shows up for a common trade-off: a regularly cleaned array that is 45° off south still beats a south array left dirty for a full season at a moderate soiling rate. Principle: quantify soiling with a stated rate and wash plan, then compare that kilowatt-hour cost to design compromises you cannot change. Use weather-normalized output and clear-day curve checks so you wash on evidence, not a rigid calendar alone. For proposal reading, pair this with the proposal checklist and ROI method.
Uncertainty and limits
- PVGIS PVcalc is a typical-year model, not a forecast. Interannual weather can move annual yield by several percent (plan around a P50-style central estimate; financing often uses a more conservative P90-style band). - Daily soiling rates are literature bands applied to Ahvaz yield. They are not measured on this coordinate. Dust storms, sticky films, and bird droppings can break a simple linear sawtooth. - Rain can reset soiling earlier than your planned wash. A dry Ahvaz stretch without rain is the stressful case this model stresses. - The 10% non-soiling loss is deliberate so dust is visible as a separate lever. Installer proposals that already embed average soiling in a 14% loss will look different on paper. - No currency, cleaning-labor cost, or water cost in this study. Energy recovered still has to clear the cost and safety of roof access. - No shade, clipping, or module temperature sweep here.
What to do with this
1. Ask what soiling assumption (percent or wash plan) sits inside any production estimate. 2. Log dry streaks and clear-day peak power; wash when the curve shifts down and rain did not reset it. 3. If the roof must face southwest, prioritize cleaning discipline before chasing another kilowatt of nameplate. 4. Treat west-facing yield hits and multi-month dirty south arrays as different problems: one is geometry, the other is O&M.
Closing
For this Ahvaz 8 kW south baseline (13,301 kWh clean), a mild 45° southwest compromise costs about 397 kWh/year. Skipping from weekly to 90-day cleaning at 0.10%/day costs about 552 kWh/year more. At 0.25%/day, a 90-day interval alone loses about 1,496 kWh/year versus clean. In dusty climates, the wash plan is not a footnote next to compass direction.
Frequently asked questions
- Does skipping panel cleaning really cost more than a mild southwest roof?
- On this Ahvaz 8 kW run at 0.10%/day soiling, 90-day versus weekly cleaning costs about 552 kWh/year more, which exceeds the ~397 kWh penalty of a clean 45° southwest array.
- Are the soiling rates measured in Ahvaz?
- No. Yield is from PVGIS for Ahvaz coordinates. Daily rates are dusty-climate literature bands (NREL soiling-station ranges and high arid field rates). Local sensors would refine the numbers.
- How often should I clean panels in a dusty city?
- Use monitoring: compare clear-day peaks across dry weeks and after rain. This study shows 90-day waits can cost hundreds of kWh per year on 8 kW; weekly or monthly plans cut that average loss sharply.
- Is a west-facing roof worse than dirty south panels?
- Clean west here loses about 1,894 kWh/year versus clean south. High-rate 90-day soiling on south loses about 1,496 kWh. Geometry and O&M can reach a similar scale for different reasons.
- Does rain replace manual cleaning?
- Sometimes. This model stresses long dry intervals. Rain can reset soiling earlier; sticky dust or incomplete wash still needs a planned clean.
Sources
- PVGIS photovoltaic geographical information system (PVcalc) (European Commission JRC)Accessed Jul 31, 2026
- Time Series Analysis of Photovoltaic Soiling Station Data (NREL TP-5J00-69131) (NREL)Accessed Jul 31, 2026
- PV Soiling Losses: Measurements, Modeling, and Mitigation Strategies (NREL)Accessed Jul 31, 2026
- Soiling Losses – Impact on the Performance of Photovoltaic Power Plants (IEA PVPS T13-21:2022) (IEA PVPS)Accessed Jul 31, 2026
- Photovoltaic Module Soiling Map (NREL)Accessed Jul 31, 2026
Related articles
- Dust on Panels: When Dirt Shows Up in Your Data
Dust, pollen, and bird activity slowly lower output without tripping faults. Monitoring helps you see soiling before it costs a full month of production.
- Solar Maintenance: What to Check Each Season
PV modules need little routine care, but seasonal checks on cleanliness, wiring, and production data keep performance strong for decades.
- Compare Solar Months Fairly With Weather Normalization
July was cloudy so production dropped. That is weather, not necessarily a broken inverter. Normalization adjusts for sun and temperature so trends reveal real equipment changes.
- What Really Cuts Solar Production (From Weather to Wiring)
Daily and annual solar output depends on irradiance, shade, temperature, tilt, equipment health, and system losses. Monitoring helps separate normal variation from faults.
- Tilt and Direction: How Roof Angle Shapes Solar Yield
Tilt and compass direction determine how much sunlight strikes your modules across seasons. Small deviations are often acceptable; large ones are not.
- Solar Monitoring: Catch Problems Before They Cost You
Why monitoring matters, module vs string data, reading production curves, clipping and soiling, weather-normalized comparisons, performance ratio, and alerts worth keeping.
- Solar Proposal Checklist: What a Real Quote Must Show
A low headline price means little without a documented production model, equipment list, warranty terms, and interconnection scope. Here is what to check before you sign.
- Solar Payback Math for Iranian Homeowners
There is no single national payback number for solar in Iran. Here is the calculation method, built from your own bills and production estimate, that you can use with any price or tariff you confirm locally.
- Solar ROI and Bills: How to Read the Real Payback
Read your electricity bill, compare net metering and self-consumption, cut load before sizing solar, estimate payback in Iran, review proposals, and manage peak demand.
- Self-Consumption: Using Your Solar Before It Leaves Home
Self-consumption is the share of solar kWh you use on site instead of exporting to the grid. Timing of loads and production determines how high that share can go.
- Better Temp Coefficient or Cooler City? What Moves Hot-Climate Yield
On an 8 kW Shiraz run, a −0.29%/°C TOPCon coeff beats −0.34%/°C PERC by ~146 kWh/year. Moving the same PERC to cooler Isfahan gains ~278 kWh.